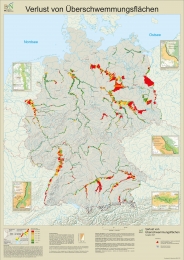
Loss of inundation areas

Map content
The morphological floodplain (that is the floodplain under natural conditions) is divided into two areas: the disconnected areas are called the former floodplain, the areas that can still be inundated are called the active floodplain. The active floodplain is determined on the basis of flood probability data (medium probability, “100-year flood”). The boundaries of the morphological floodplain are determined by a semi-automated calculation based on a detailed digital terrain model and flood areas of rare floods (low probability). This boundary of the morphological floodplain and the boundary of the active floodplain yield the area of the former floodplain.
The area of investigation relates to the floodplains of 79 rivers with a total length of 10,297 river kilometres. The study area of the individual rivers begins in each case at the point of the river where the catchments exceed 1,000 km². Areas closer to the source and tidal areas were not surveyed.
Map display
The map shows the assessed 1-km floodplain sections proportionally to their area – separately by left and right bank. The width of each segment in the map refers to the average width of the corresponding floodplain segment, but twofold oversized. For example, a floodplain with of 1,000 m corresponds to a width of 2 mm in the map. Floodplains with a width smaller than 100 m are not displayed.